Toolkit
Causes Diagram
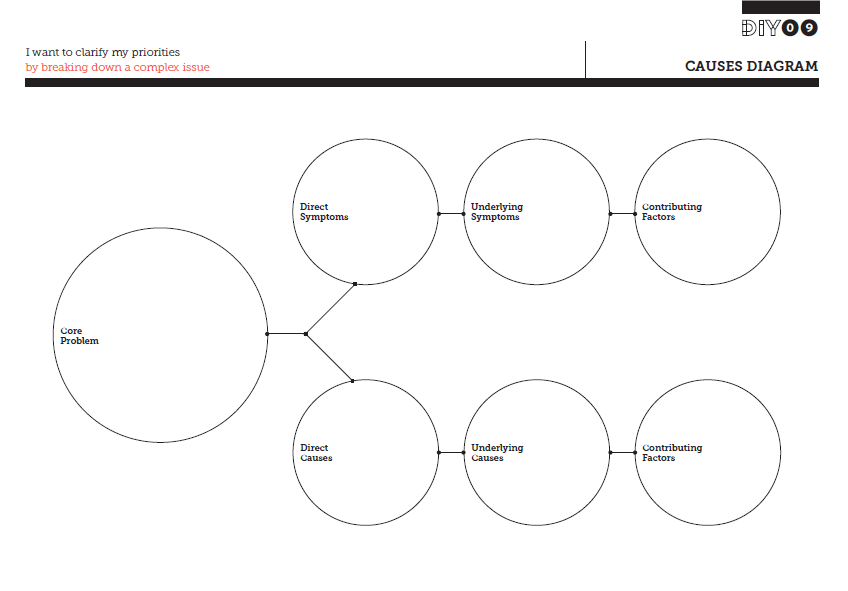
Equipped with the insights from the ‘Prioritising information and spotting patterns‘ exercise, you and your team can start to develop causal explanations for the problems you are trying to solve:
- What are the direct and underlying symptoms of this problem?
- What is causing this problem?
- What is contributing to it?
Use the Causes Diagram to analyse the information and evidence you have gathered to date. Use the information and insights from your Starting Point Assessment, and from the 5 Whys exercises (if you have completed it) and map them onto the diagram.
If you are doing this in a group, make sure that you leave the time and space to debate and discuss. It can sometimes be hard to distinguish between a symptom and a cause!